
Digital Workplace
A good digital workplace creates flow, not friction. Measure fragmented tools, duplicate systems, constant switching between apps, and information overload — and turn everyday digital friction into measurable improvements.

Digital Friction Services
Resolving friction creates business value. And here is how we do that…
The better people experience their digital work environment, the more smoothly work flows and the higher engagement and productivity become. Improving that experience starts with making visible what stands in its way: the small disruptions, awkward handovers, and unstable tools that quietly erode flow and focus — even when traditional metrics look healthy. We call those negative experiences friction.
Our DEX-kompas™ tracks them down by combining employee feedback with technical and operational data, and makes friction visible across six experience dimensions where people, process, and technology come together. This results in a clear DEX Index™ that shows where the experience is strong, where work slows down, who is affected, and where improvements have the greatest impact.
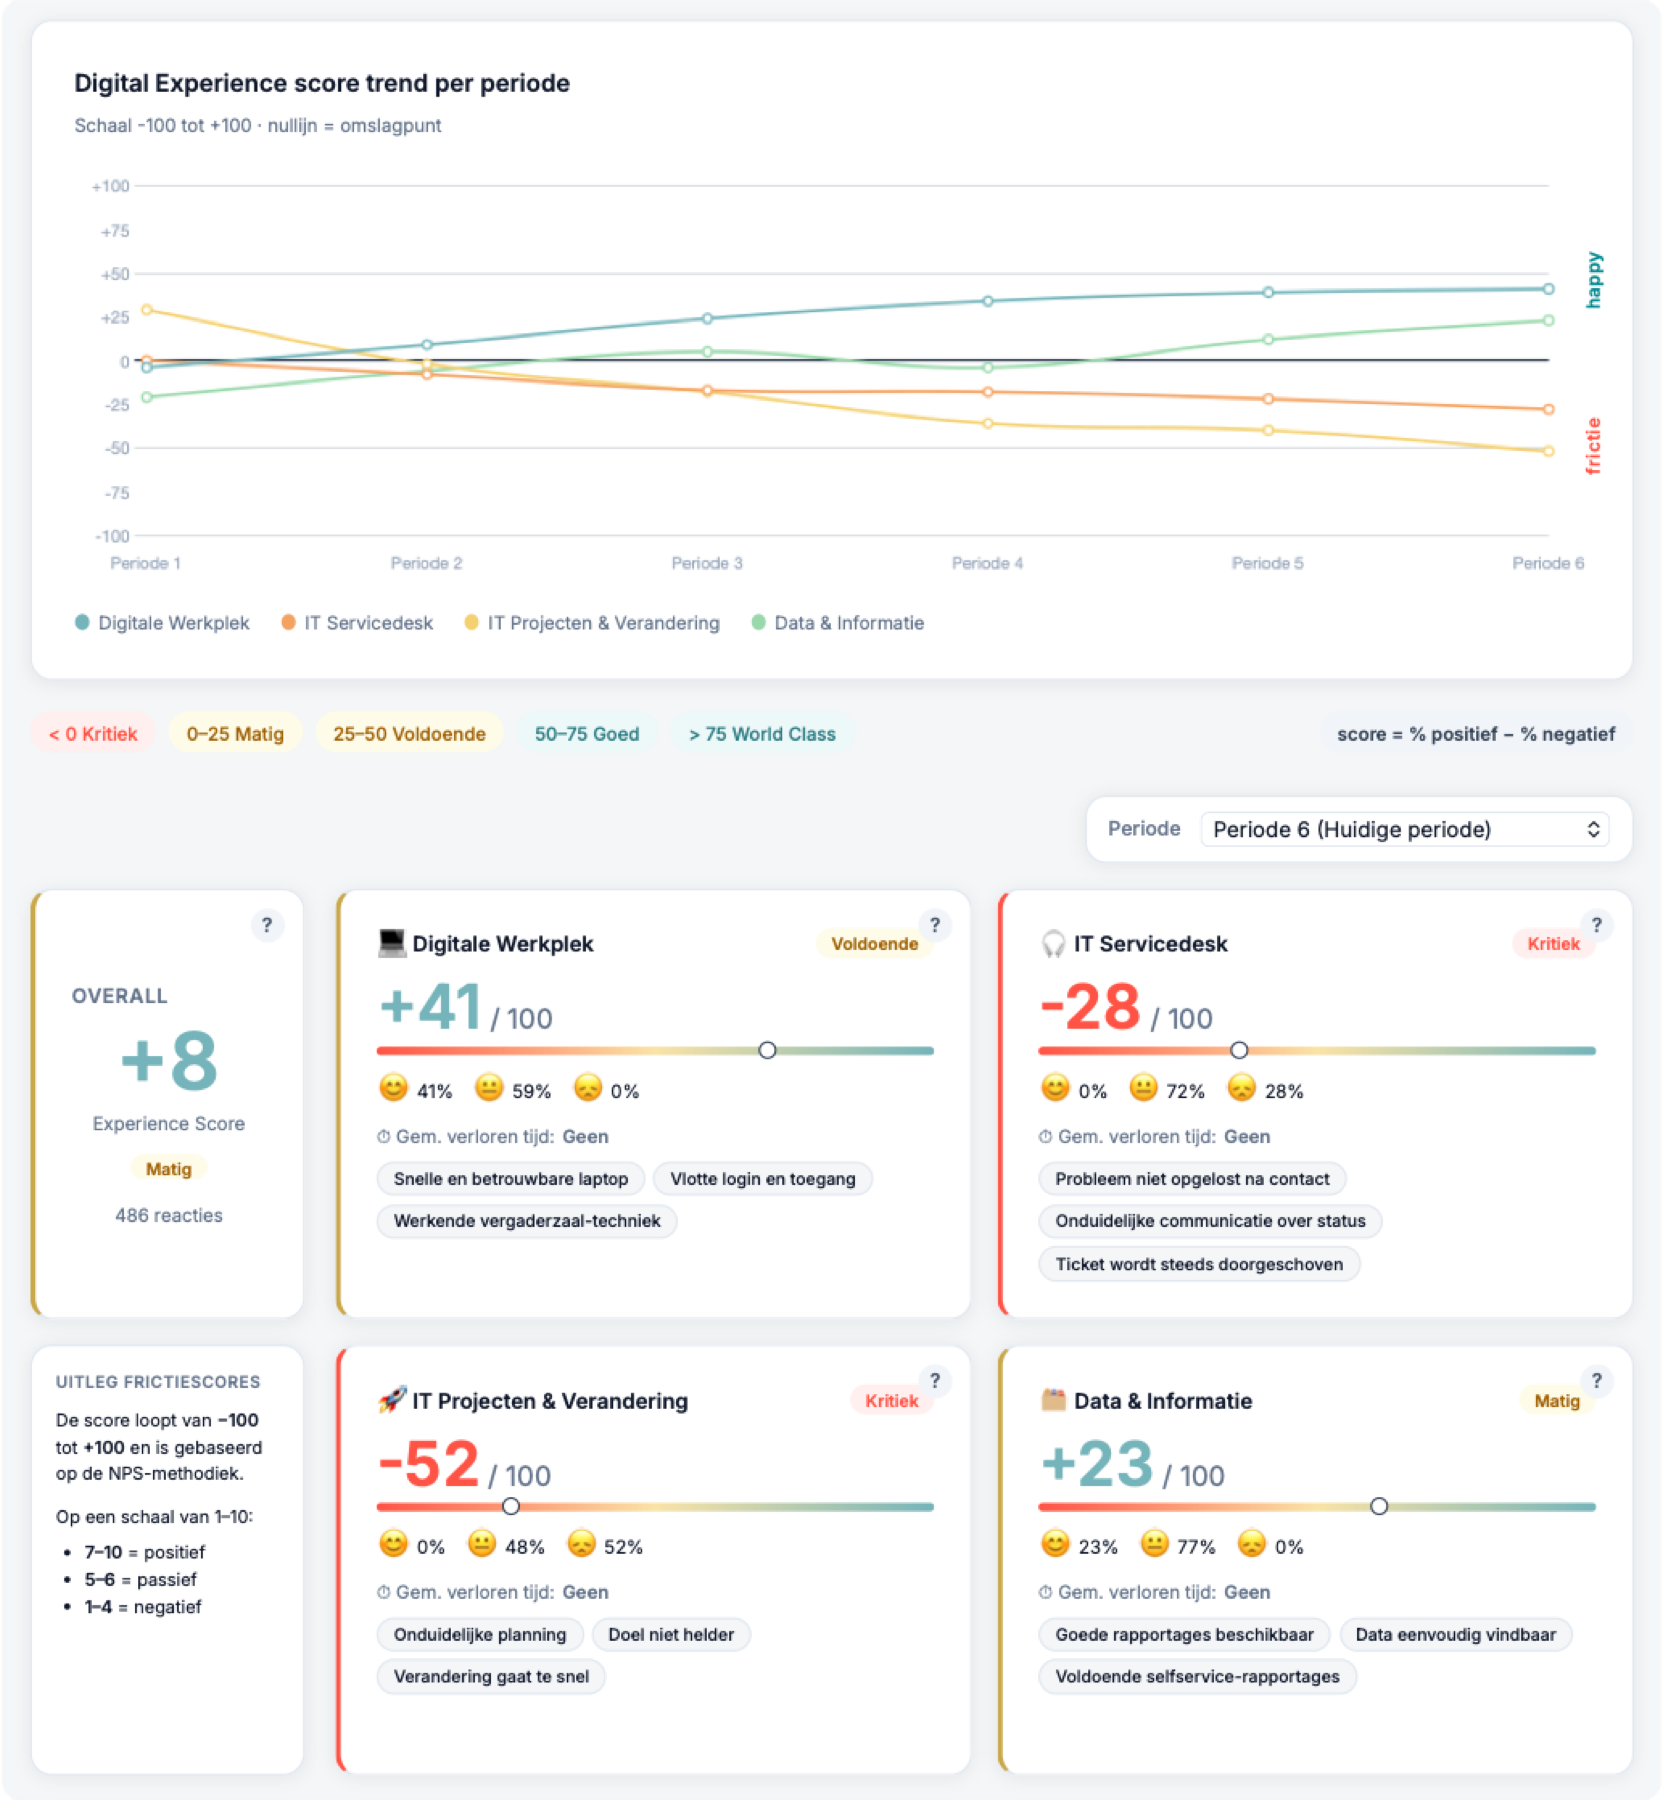
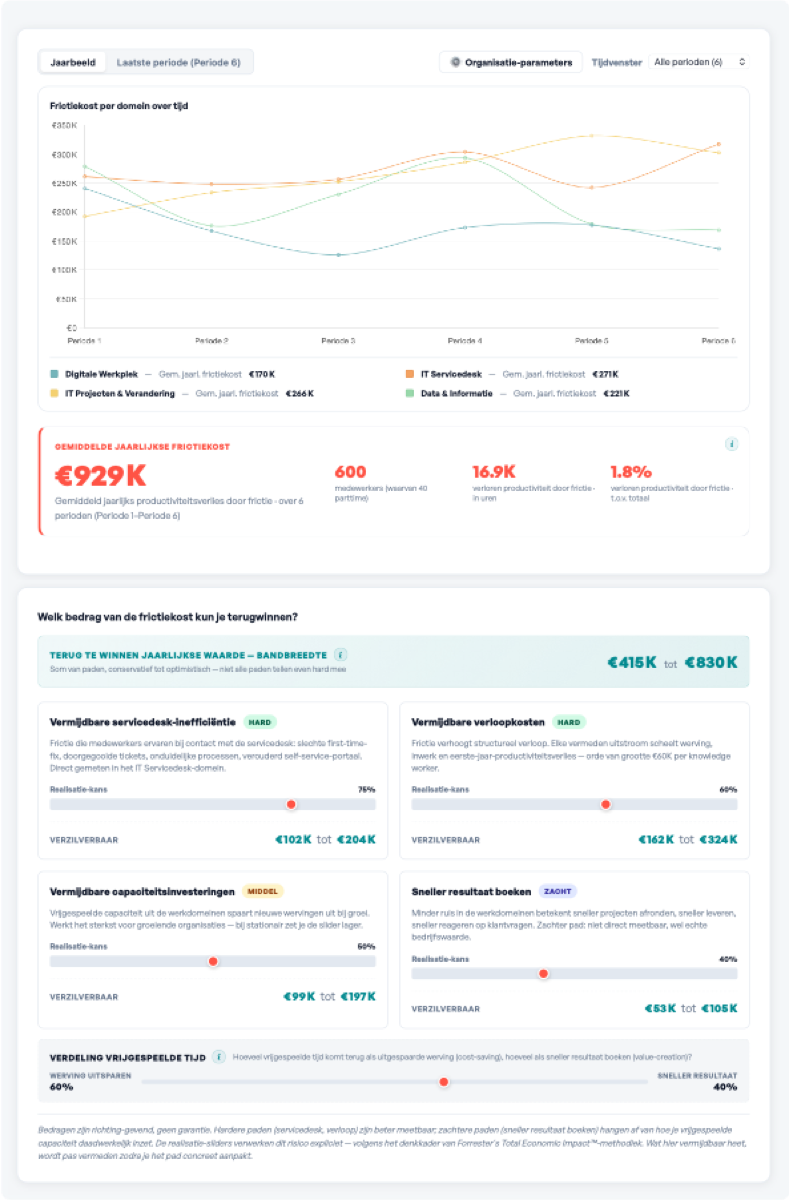
DEX-calculator
A better digital experience increases people's satisfaction — and strengthens the organization's performance. To invest in it deliberately, management also needs to understand the financial side. Our DEX-calculator translates the quality of the digital experience into measurable business value. By combining lost time, awkward workflows, and operational data with realistic productivity benchmarks, it makes visible how digital friction — the negative experiences that undermine the experience — affects performance, support costs, and the return on investment (Return On eXperience, ROX). Instead of assumptions, you get clear insight into how much potential goes untapped, which friction factors cause the highest costs, and where improvements deliver the greatest return.
The DEX-calculator does not promise savings — but it delivers decision-ready insights and well-founded business cases for smarter, prioritized investments in a stronger digital experience.
DEX-calculator demoApproach
Resolving Digital Friction, Step by Step
Digital friction rarely has a single cause. It arises where technology, processes, support, and daily work come together. Our approach focuses on making that friction visible, quantifying its impact, and delivering targeted improvements where they yield measurable value. We do not start with frameworks or contracts — we start with friction.
We start by creating a clear insight into how digital work is actually experienced. With targeted diagnostics, focused feedback, and analysis of existing operational data, we identify where work slows down, where effort increases, and where trust declines — and where friction concentrates. The result is an initial friction baseline and priority map.
Next, we structure and quantify what we see. Our DEX-kompas™ brings together technical signals (performance, stability, availability), process signals (handovers, rework, ticket patterns), and experience signals (effort, interruptions, loss of flow) into a clear DEX Index™ — measurable across teams, services, and locations.
Reducing friction is not only about improving the experience — it is about protecting productivity. With the DEX-calculator we translate friction signals into an indicative economic impact, making clear where value is lost, which friction factors cause the highest costs, and where improvements deliver the greatest return.
Insight alone does not reduce friction. Action does. That is why we help organizations implement targeted improvements — from interface design and process adjustments to support interactions and communication. Use our DEX-kompas™ as an ongoing measurement service (subscription), so that digital experience management becomes a practical, ongoing discipline.
Custom
A Digital Experience dashboard is never static. We can easily extend it for you with your own metrics, tailored to your organization's needs. The real strength, however, is that the XLA framework is already built in, so you can quickly measure what really matters. And with ROX you not only track the experience, but also link it directly to business value (€).
Every organization is unique, but no one should have to start completely from scratch. Our dashboard combines ready-made insights with the flexibility to grow, adapt, and align with your strategy. That means less time spent setting up metrics, and more time delivering tangible improvements in user happiness, productivity, and results.
Discover where digital friction slows your organization down and where removing it creates real business value. The DEX-kompas™ shows where workflows get stuck, what this costs, and which improvements deliver the greatest impact.
Request a demoThe six most-measured experience dimensions where people, process, and technology come together.
A good digital workplace creates flow, not friction. Measure fragmented tools, duplicate systems, constant switching between apps, and information overload — and turn everyday digital friction into measurable improvements.
Business applications should strengthen productivity, not undermine it. Measure slow performance, unclear workflows, missing integrations, and shadow IT workarounds — and turn everyday application friction into measurable improvements.
Your service desk should help people get back to work, not get stuck in a queue. Measure wait times, repeat tickets, unclear status updates, and gaps in self-service — and turn support friction into measurable improvements.
Your intranet should help people work, not slow them down. Measure search frustration, dead links, stalling workflows, and mobile limitations — and turn everyday digital friction into measurable improvements.
IT projects should make change workable, not take people by surprise. Measure unclear planning, an unclear goal, and a pace of change that is too high — and turn project friction into measurable improvements.
Good information should speed up decisions, not slow them down. Measure data that is hard to find, missing reports, and inadequate self-service insights — and turn information friction into measurable improvements.
You view the DEX-kompas™ in our demo environment. Log in to the demo portal to experience the interactive friction dashboard and the full approach.